Atomic emission spectroscopy is the determination of the chemical composition of a substance based on the spectrum emitted by the atom. Under normal conditions, the atom is in a stable state and its energy is the lowest. This state is called the ground state. But when an atom is subjected to energy (such as heat, electricity, etc.), the atom acquires energy by colliding with high-speed moving gaseous particles and electrons, causing the electrons in the outer layer of the atom to transition from the ground state to a higher energy level. An atom in this state is called an excited state. The energy required for an electron to transition from a ground state to an excited state is called an excitation potential. When the applied energy is large enough, the electrons in the atom are separated from the nucleus and the atom becomes an ion. This process is called ionization.
The energy required for an atom to lose an electron to become an ion is called the first-order ionization potential. The outer electrons in the ions can also be excited, and the energy required is the excitation potential of the corresponding ions. The atoms in the excited state are very unstable and transition to the ground state or other lower energy levels in a very short time. When an atom transitions from a higher energy level to a ground state or other lower energy level, excess energy is released, which is radiated in the form of electromagnetic waves of a certain wavelength. The wavelength of each line emitted depends on the difference between the two energy levels before and after the transition.
Since the atom has many energy levels, the outer electrons can have different transitions after being excited, but these transitions should follow certain rules (ie, "spectral law"), so a series of atoms for a particular element can produce a series of Characteristic spectral lines of different wavelengths, which are arranged in a certain order and maintain a certain intensity ratio. Spectral analysis is to identify the presence of elements (qualitative analysis) by identifying the characteristic spectra of these elements, and the intensity of these spectral lines is related to the content of the elements in the sample, so the intensity of these lines can be used to determine the elements. Content (quantitative analysis).
I. OverviewThe spectrum analyzer is a commonly used instrument in the usual optical communication wavelength division multiplexing products. When the WDM system first appears, it is often used to test the signal wavelength and optical signal to noise ratio. Its main feature is that the dynamic range is large, generally up to 70dB; the sensitivity is good, up to -90dBm; the resolution bandwidth is small, generally less than 0.1nm; it is more suitable for testing optical signal-to-noise ratio. In addition, the measurement wavelength range is large, generally 600~1700nm. However, the test wavelength accuracy is not as accurate as the multi-wavelength meter.
A spectrum analyzer can be used for the measurement of the spectrum, the signal power of each reference point path, the optical signal to noise ratio of each reference point, the gain coefficient of each wavelength of the optical amplifier, and the gain flatness. The spectrum analyzer now also integrates WDM analysis software, which can conveniently display the parameters such as the center frequency, power, optical signal-to-noise ratio of each wavelength of WDM in a menu.
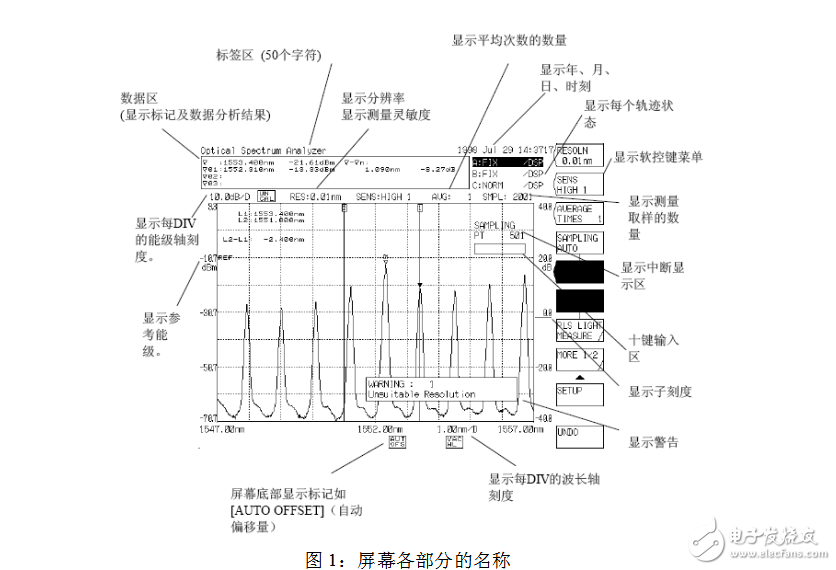
Second, the test of commonly used parametersThe screen of the spectrum analyzer displays measurement conditions, marker values, other data, and measurement waveforms. The names of the various parts of the screen are shown below:
1. Measurement of spectral spectrum width
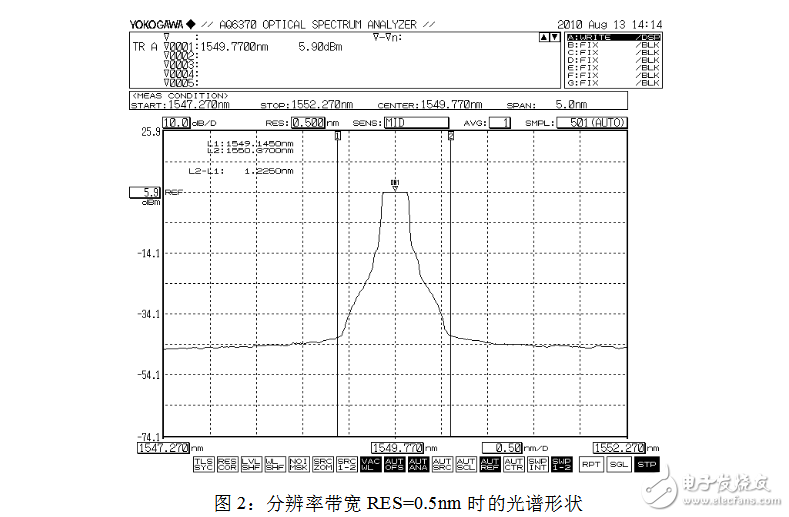
The spectral width is the bandwidth of the spectrum. The spectral width of the LD and LED can be measured using a spectrum analyzer. When measuring the spectral width of the spectrum, pay special attention to the resolution of the spectrum analyzer system. In principle, the resolution of the spectrum analyzer should be less than 1/10 of the spectrum width of the measured signal. Generally, the recommended setting is at least less than the measured value. 1/5 of the signal spectrum width.
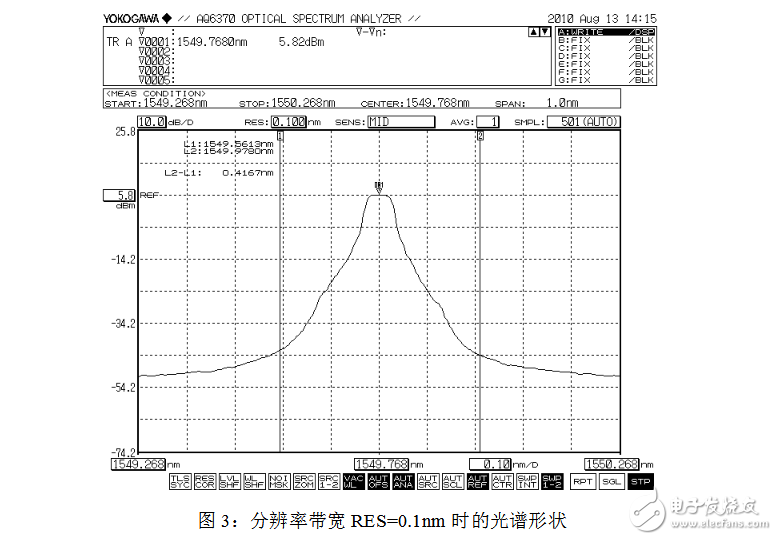
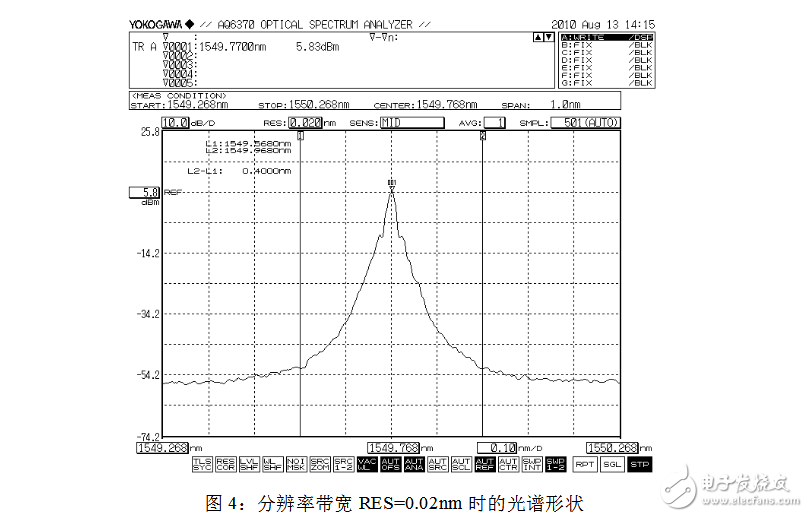
In actual measurement, in order to accurately measure data, the resolution bandwidth is generally selected to be 0.1 nm or less. The resolution bandwidth RES is located in the first item in the SETUP menu, and the size of the resolution bandwidth to be set can be directly input. As shown in Figures 2, 3, and 4 below (the difference between the spectral shapes is only shown in the figure), when the selected resolution bandwidth is different, the spectral shape observed from the spectrum analyzer is very different, and the measured The difference in spectral width.
While observing the spectral spectrum width, parameters such as the center frequency, bandwidth, peak power, and side mode suppression ratio of the spectrum can also be read by the spectrum analyzer. At the same time, the MARKER menu can be started and the corresponding identification can be performed to conveniently measure the parameter values ​​to be tested.
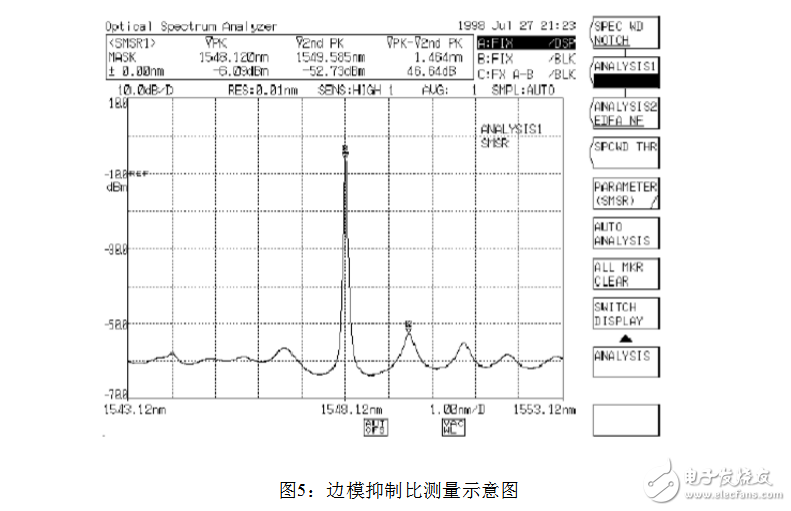
2. Measurement of side mode suppression ratio
Side-Mode Suppression RaTIo (SMSR), which represents the energy level difference between the peak energy level and the horizontal mode energy level.
Generally, when measuring the side mode suppression ratio, you need to use the corresponding keys in the MARKER menu and the ANALYSIS menu. Use the MARKER menu to identify the main wave peak and the highest sub-peak, and read the peak power values ​​of both. The side mode suppression ratio is the energy level difference between the highest peak and the second peak. The final value can be calculated from the corresponding suboption in the ANALYSIS menu.
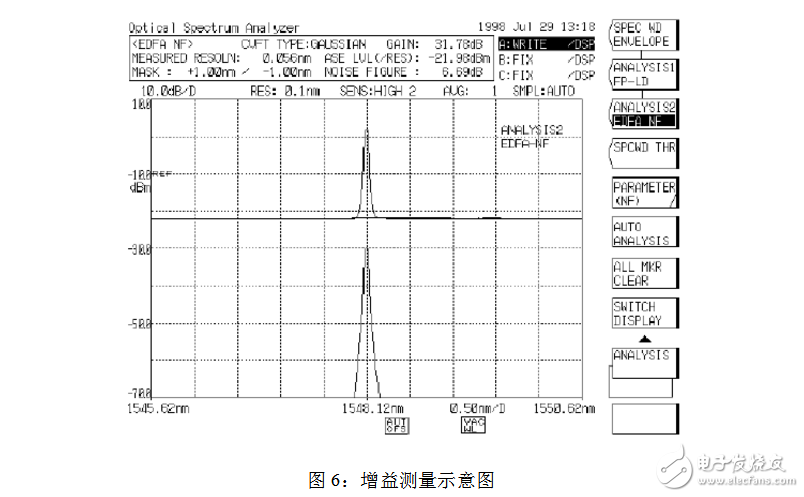
3. Measurement of gain
When testing an OA board or optical amplifier module, you need to test the gain parameter (Gain). The gain is defined as the ratio of the output signal power outP to the input signal power inP. The general expression of the gain is shown in equation (1):
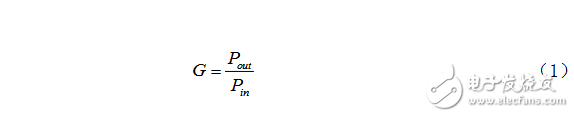
The above formula is used in the case of mw. If the unit is dBm, the value of G is the difference between the two.
When making gain measurements, you need to use the relevant options in the TRACE menu. First set Trace A to the input light before the amplifier is not connected, press Fix A; then set Trace B to the output light after passing through the fiber amplifier, press Fix B; take the peak power of both to calculate.
In the case of multiple waves, the gain flatness and gain slope can also be tested. Wherein, the gain flatness is the difference between the maximum value and the minimum value of the gain; the gain slope is a ratio of two wavelengths at which the optical amplifier operates at two gain state change values. The gain slope is mainly used to measure the relative change of the gain of different wavelengths of the optical amplifier. The smaller the gain slope, the better the consistency of each wavelength when the gain of the optical amplifier changes, and the easier it is to achieve the gain balance of each wavelength.
When using the spectrum analyzer to measure the gain slope, it is necessary to assume that the optical amplifier operates in two gain states (if 20dB and 25dB), and then perform gain points at different wavelengths such as 1550nm, 1551nm, 1552nm, and 1553nm. By measuring and recording the gain values ​​obtained at each wavelength point, the gain slope can be calculated.
4. Measurement of noise figure
An important function of the spectrum analyzer is to measure the equivalent noise figure (NF) of the EDFA, referred to as the noise figure.
First, the general formula for the noise figure of an optical amplifier is shown in equation (2):
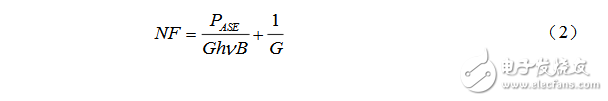
The first item on the right side is the ASE noise power, wB is the measurement spectrum width; h is the Planck constant; ï® is the center frequency, that is, the value obtained after finding the peak wavelength value of the trajectory B waveform and then performing the frequency conversion; For gain.
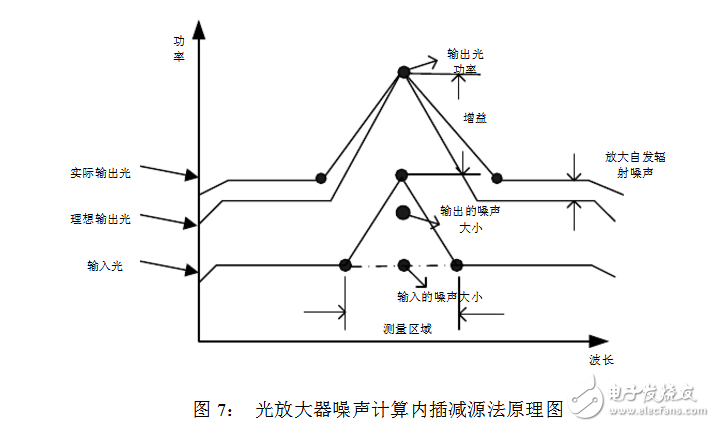
At present, all optical spectrum analyzers generally adopt optical fiber noise figure measurement methods such as interpolation subtraction method, time domain extinction method and polarization extinction method, and different measurement methods obtain different measurement accuracy of noise figure. The interpolation subtraction method uses a curve fitting algorithm. The ASE is inserted in the wavelength of the signal and the noise is calculated using a four-point two or more accurate curve fitting method.
The noise includes the spontaneous emission noise ASEP and the amplified source noise ASEGPï‚´ generated during the amplification process. The schematic diagram of the interpolation subtraction method used by the spectrum analyzer is shown in Fig. 7.
The TRACE menu and the ANALYSIS menu are required for NF measurements using a spectrum analyzer. First set the input light of the input fiber amplifier to a writable state, click writeA, and then fix the track Fix A; then set the spectrum of the light output from the fiber amplifier to a writable state, click writeB, and then fix the track Fix B; Then press the EDFA NF sub-option in the ANALYSIS menu to get the result of the NF calculation of the spectrum analyzer.
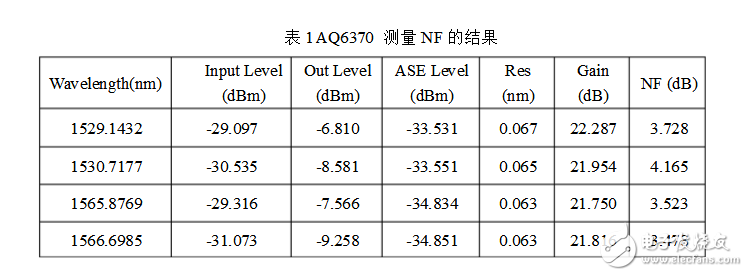
Table 1 shows the analysis results obtained by using the spectrum analyzer Yokogawa AQ6370 and selecting the EDFA_NF sub-option. The instrument resolution is set to 0.1 nm, and the sensitivity is selected as MID. There are 4 wavelengths of signals.
5. Measurement of system OSNR
In DWDM systems, optical signal-to-noise ratio (OSNR) can accurately reflect signal quality and become the most commonly used performance indicator.
The definition of OSNR is as follows:
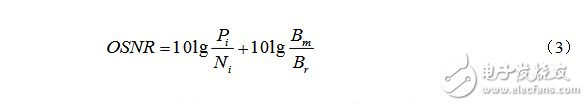
Where: iP is the signal power in the i-th path; rB is the reference optical bandwidth, usually 0.1 nm; mB is the noise equivalent bandwidth; iN is the noise power in the range of equivalent noise bandwidth mB. The commonly used formula for calculating OSNR is:
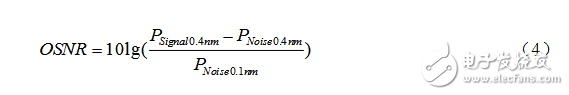
A common method of measuring OSNR using a spectrometer is the integration method. Usually, the minimum resolution bandwidth (RBW) that the spectrum analyzer can provide is used to scan the spectrum to be measured, and the power in the range of rB around the center frequency is calculated as the signal power by the integral method. The power in the mB range of the channel is the noise power. The OSNR is obtained. The integral range of the signal light power is generally in the bandwidth range of 0.4 nm; the integral range of the noise power is taken to be in the range of 0.4 nm and 0.1 nm. Generally, the signal optical power in the 0.4 nm bandwidth range is subtracted from the noise optical power in the 0.4 nm bandwidth range, and the difference is divided by the noise optical power in the 0.1 nm bandwidth range, and then the logarithm value is 10 times. Calculate the magnitude of OSNR. The integration method is used to test the signal and noise power. Specific steps are as follows.
1) Turn on the test channel OTU and use the integral method to test the power in the spectral range of the entire signal, which is recorded as 1P.
2) Turn off the test channel OTU and test the power in the spectral range of the entire signal by the integral method, which is recorded as 2P. 3) Keep the OTU off state, and use the integral method to test the power in the range of the equivalent noise bandwidth Br, which is recorded as 3P. For convenience, the engineering test can also convert the P2 value to 3P in the mB range. 4) Calculate the OSNR.
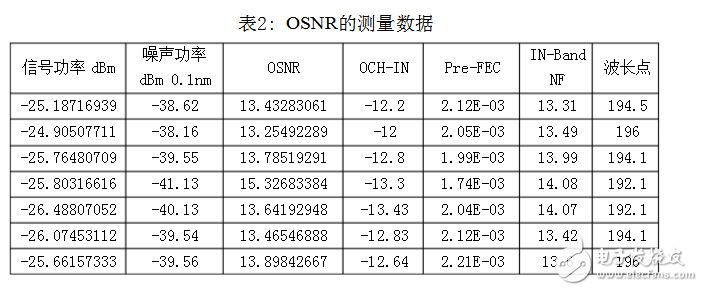
The OSNR test of the TST3 board was carried out during the experiment to obtain the following test results.
The above examples are some of the operations commonly used in the usual use of the spectrum analyzer. In the paper, the usual test parameters are only used to illustrate the more commonly used parameters. There are many other parameters that can be measured using the spectrum analyzer. Detailed descriptions, such as the measurement of channel isolation during the test of the comb filter (Interlever) can also be directly analyzed by the spectrum analyzer to obtain the test results.
A detailed description of the various menus in the spectrum analyzer requires a detailed manual of the spectrum analyzer. In the actual test, the test conditions need to be set according to the requirements. If you are skilled in using the spectrum analyzer, you can measure the relevant indicators more quickly and accurately.
Old-fashioned Bluetooth Speaker
For Old-fashioned Bluetooth Speaker, I personally think that when many people buy Vintage speakers, the appearance is the first priority and the function is second.
We focus on retro Bluetooth speakers,It has high energy density, mini size, light weight and diversified shapes;Excellent fast charging performance, support fast charging and other excellent features with a brand-new design, showing retro nostalgia without losing fashion. It uses a 2.5-inch speaker and has many functions such as FM radio, Bluetooth fast connection, multi-mode switching, and HIFI high fidelity. Wireless Bluetooth 4-10 hours of playback (at 50% volume), which adds to its unique charm.
The sound quality of small speakers is also good. It does not have the same large speakers and power as HIFI speakers, and its sound quality cannot compete with large speakers due to physical limitations. But for the vast majority of users who are not golden ears, the use of small speakers with tablets and mobile phones is sufficient to meet their hearing requirment.
Wireless Bluetooth Speaker,Hand Free Bluetooth Speaker,Old-fashioned Bluetooth Speaker, Mini Speaker
Shenzhen Focras Technology Co.,Ltd , https://www.focrass.com